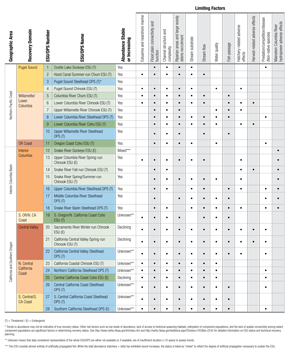
Factors Limiting Recovery
Pacific salmon and steelhead are anadromous fish, meaning they
migrate up rivers from the ocean to spawn in freshwater. These
salmonids include pink, sockeye, chum, Chinook, and coho salmon,
and steelhead trout. Of these, many populations of sockeye,
chum, Chinook, coho, and steelhead are listed as threatened and
endangered. The migratory ranges of these populations overlap,
that is, the different species make use of some of the same freshwater
habitat for rearing and spawning.
Salmon recovery on the Pacific Coast is organized by recovery
domains. Domains represent geographically-based areas within which multi-species recovery plans for anadromous salmonids
have been and are being developed in Washington, Oregon,
California, and Idaho. The broad expanse of these domains reflect
the complex life cycle of anadromous fish that spans inland streams
and rivers, coastal estuaries, and ocean waters. The land area affected
by ESA listings of salmon and steelhead on the Pacific Coast is
vast, spanning approximately 176,000 square miles in Washington,
Oregon, California, and Idaho (61% of Washington land area, 55% of
Oregon, 32% of California, and 26% of Idaho).
Recovery plans for each domain address all salmon and steelhead
populations within the geographic area. These plans have involved
extensive stakeholder input to identify the specific factors limiting the recovery and sustainability of salmon populations for each
DPS and ESU (see chart below). These factors represent many of the
challenges to recovery that are being addressed through PCSRF
investments. ESUs and DPSs are comprised of individual populations which are monitored within specific reaches of watersheds.
Based on counts of these populations (data from NOAA Fisheries Salmon Population Summary database), the stability of
individual populations is assessed, as is the aggregate health of the
populations at the ESU/DPS level.

Performance Reporting
All recipients of PCSRF funds are required to report on an extensive set of standard metrics. The sum of all these projects' metrics can be depicted in a series of "roll-up" measures that aggregate the accomplishments of many activities funded with PCSRF and state matching funds. The complete metrics for individual projects can be viewed on that project's details page.
Cumulative Program-wide Accomplishments
| Instream Habitat |
| Stream Miles Treated |
3,186 |
715 |
| Wetland Habitat |
| Acres Created |
221 |
|
| Acres Treated |
7,233 |
175 |
| Estuarine Habitat |
| Acres Created |
2,254 |
|
| Acres Treated |
7,662 |
1,476 |
| Land Acquisition |
| Acres Acquired or Protected |
191,565 |
2,518 |
Stream Bank Miles Acquired
or Protected |
4,725 |
43 |
| Riparian Habitat |
| Stream Miles Treated |
15,831 |
663 |
| Acres Treated |
155,145 |
7,646 |
| Upland Habitat |
| Acres Treated |
494,274 |
21,275 |
| Fish Passage |
| Barriers Removed |
1,594 |
59 |
| Miles Opened |
12,453 |
969 |
| Fish Screens |
| Screens Installed |
2,249 |
47 |
| Hatchery Fish Marked |
| Fry/Smolt Marked And Released |
271,428,458 |
17,224,282 |
| Research and Monitoring |
| Stream Miles Monitored |
610,020 |
31,493 |
| Planning and Assessment |
| Stream Miles Assessed |
49,821 |
2,752 |

